Art of Visual Data
02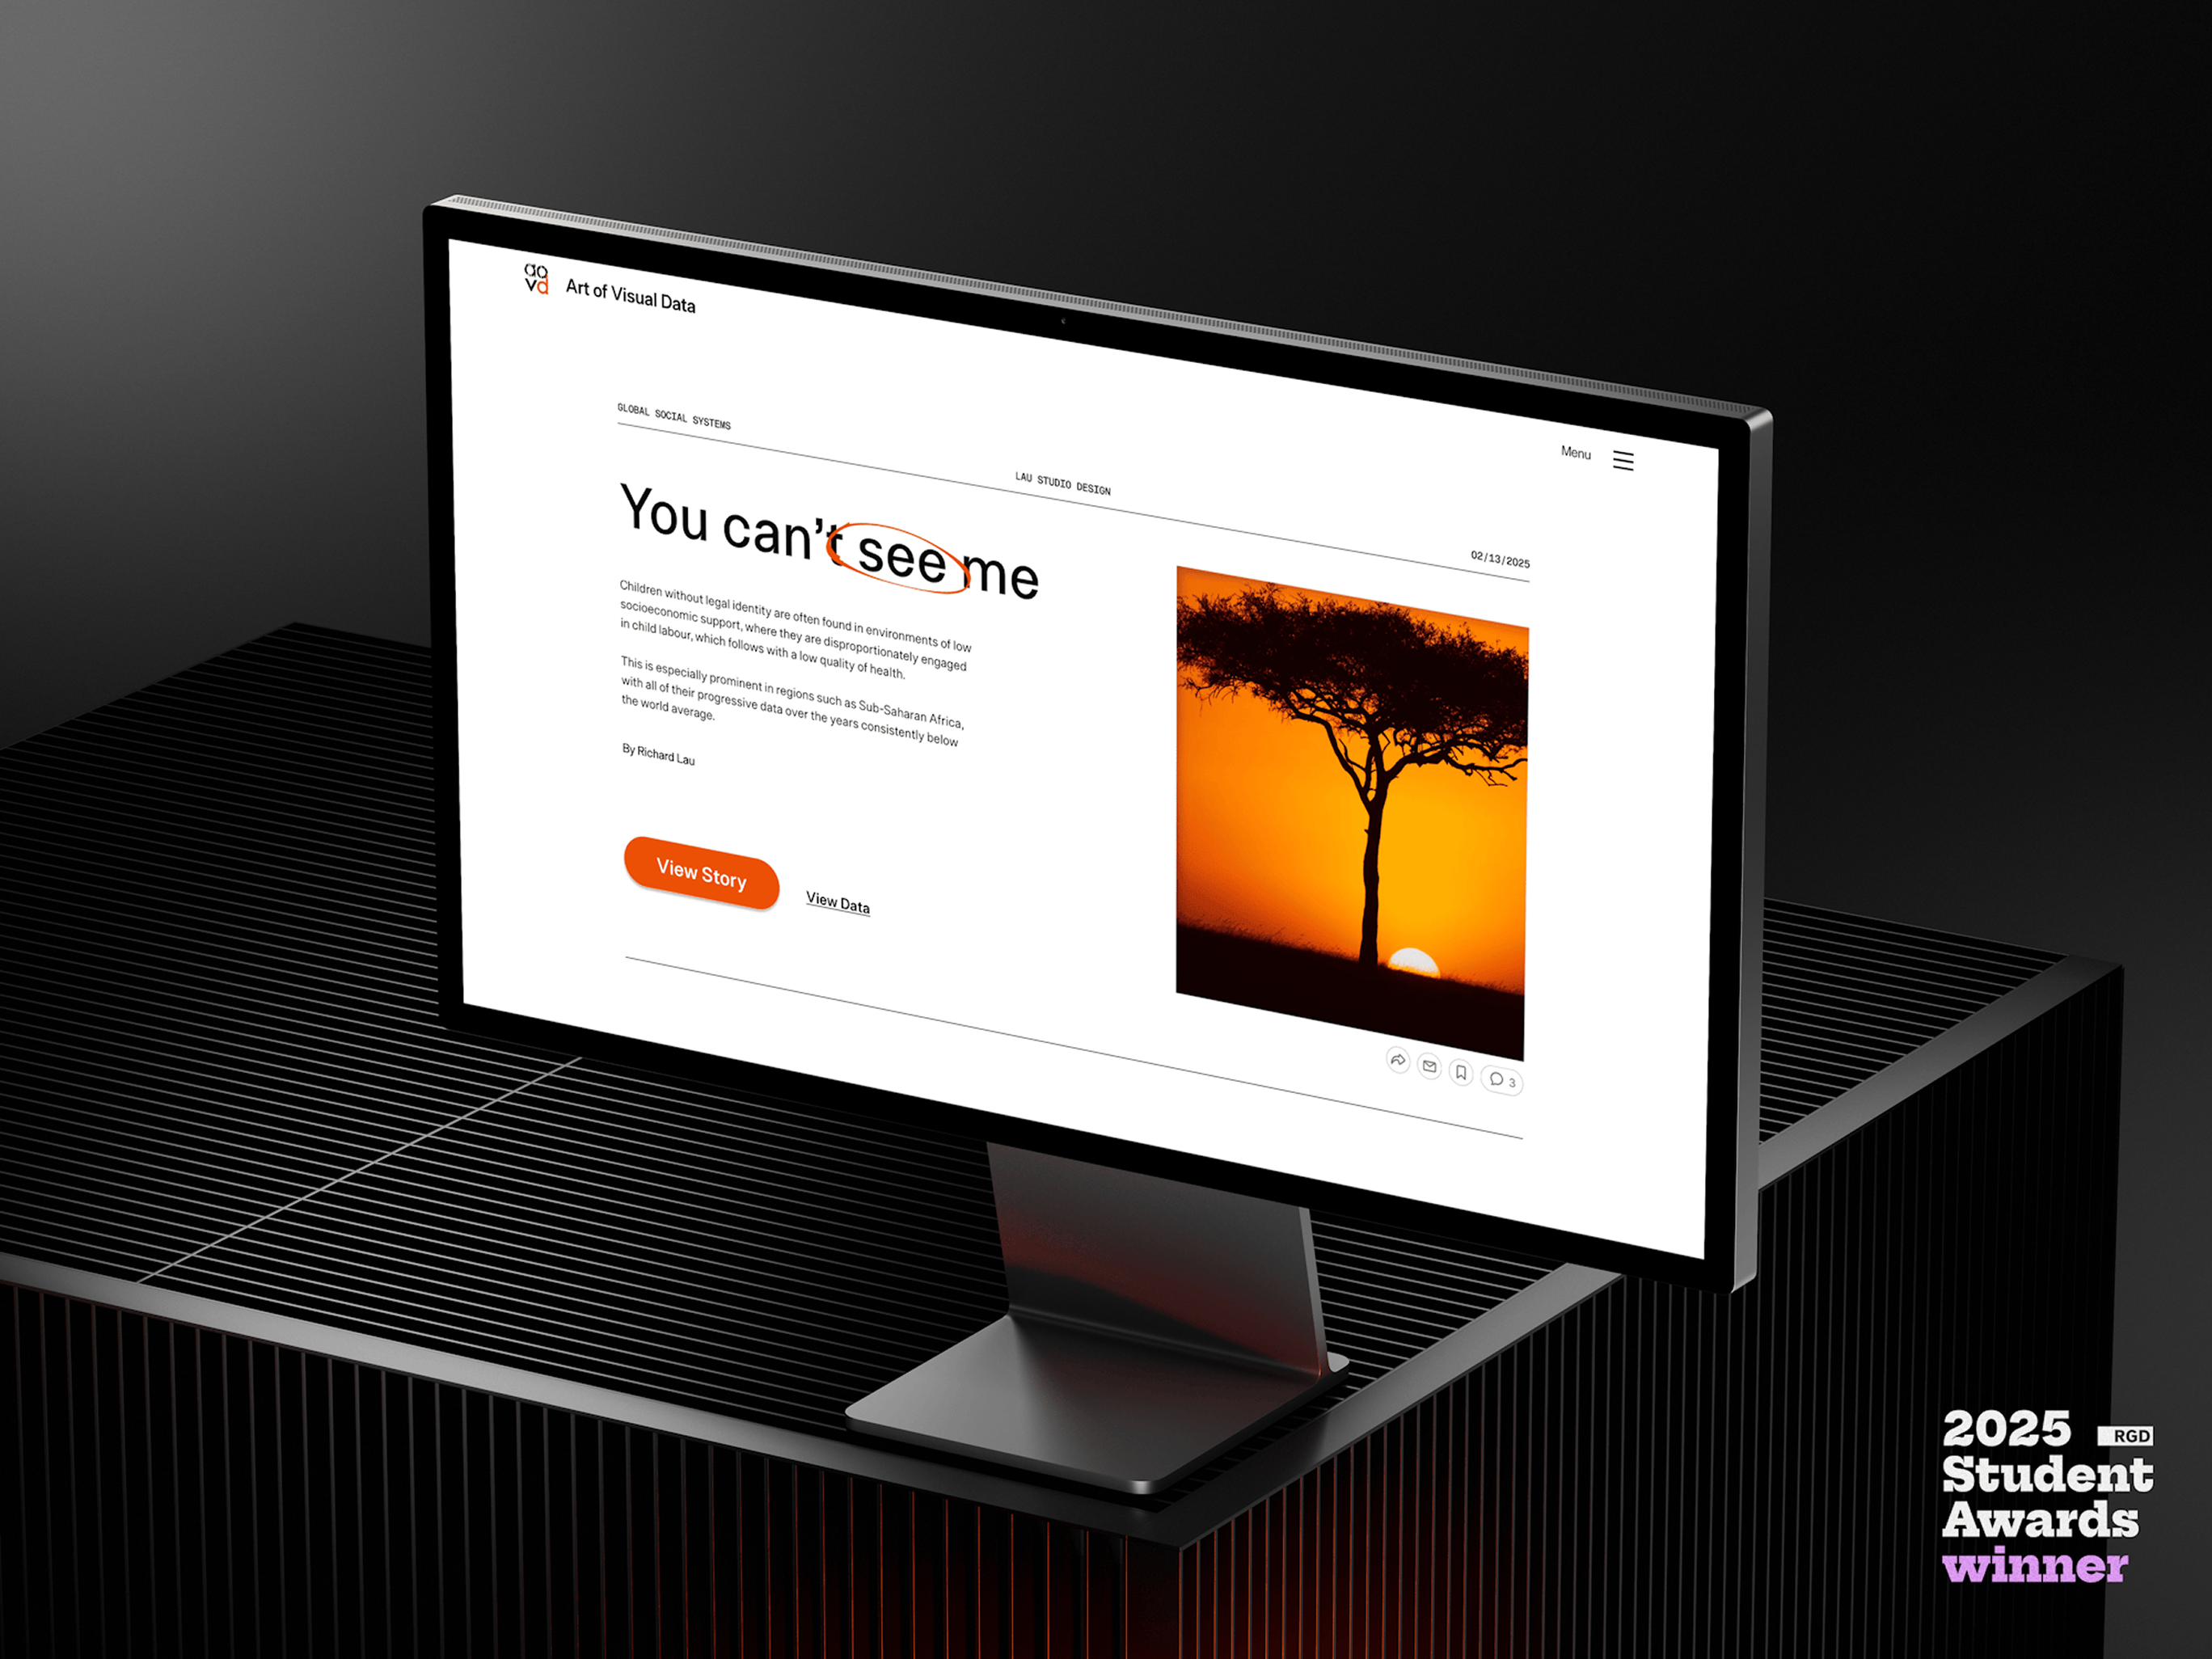
Summary
Although global datasets like the UN's Sustainable Development Goals are publicly available, they often remain cognitively inaccessible to general audiences.
In a 2025 survey, only 24% of business decision makers considered themselves data literate. This gap makes complex metrics feel distant and inaccessible—not only in understanding global issues but also in applying data within everyday decision-making.
Solution
Art of Visual Data (AoVD) tackles the challenge of making complex global data accessible and understandable. This project removes the cognitive barrier of complex data through engaging visual storytelling, accessibility optimized UI/UX, and gamified learning.
- Team
- Solo
- Timeline
- January—February
April 2025 - Discipline
- UI/UX, Typography
IMPACT
- 9x
- FASTER DATA DISCOVERY
- 60%
- IMPROVED USABILITY CONFIDENCE
- 1★
- RGD STUDENT AWARD RECIEVED
Designing emotions.
Stories within data.
Ready to see the final MVPS?
Take me there
SETTING THE STAGE
What is the issue?
Imagine a student or a data analyst trying to gather and make sense of multiple statistics from the UN 17 Sustainable Development Goals (SDG) datasets for their presentation due Friday. However, when they open the 318 page document, they’re immediately overwhelmed by the large amount of raw datasets.
THE HIGH-LEVEL DELIVERABLE
The plan to conquer cognitive overload
The objective for us is clear. To simplify the overall experience process of gathering data from these complicated, yet important datasets so individuals can confidently comprehend and retain the data connections they make.
To meet these goals, I had one primary, and two supporting deliverables in mind:
- Redefine the Traditional Data-Article [Primary Goal]
- Traditional website articles present data in cognitively inaccessible ways.
- Create Engaging Tools
- Engaging tools improve information retention and accessibility
- Immerse the user into one platform
- With a platform, the desired deliverables become a library of stories from data.


DEFINING THE USER
Meet Eris - a student at the University of Toronto
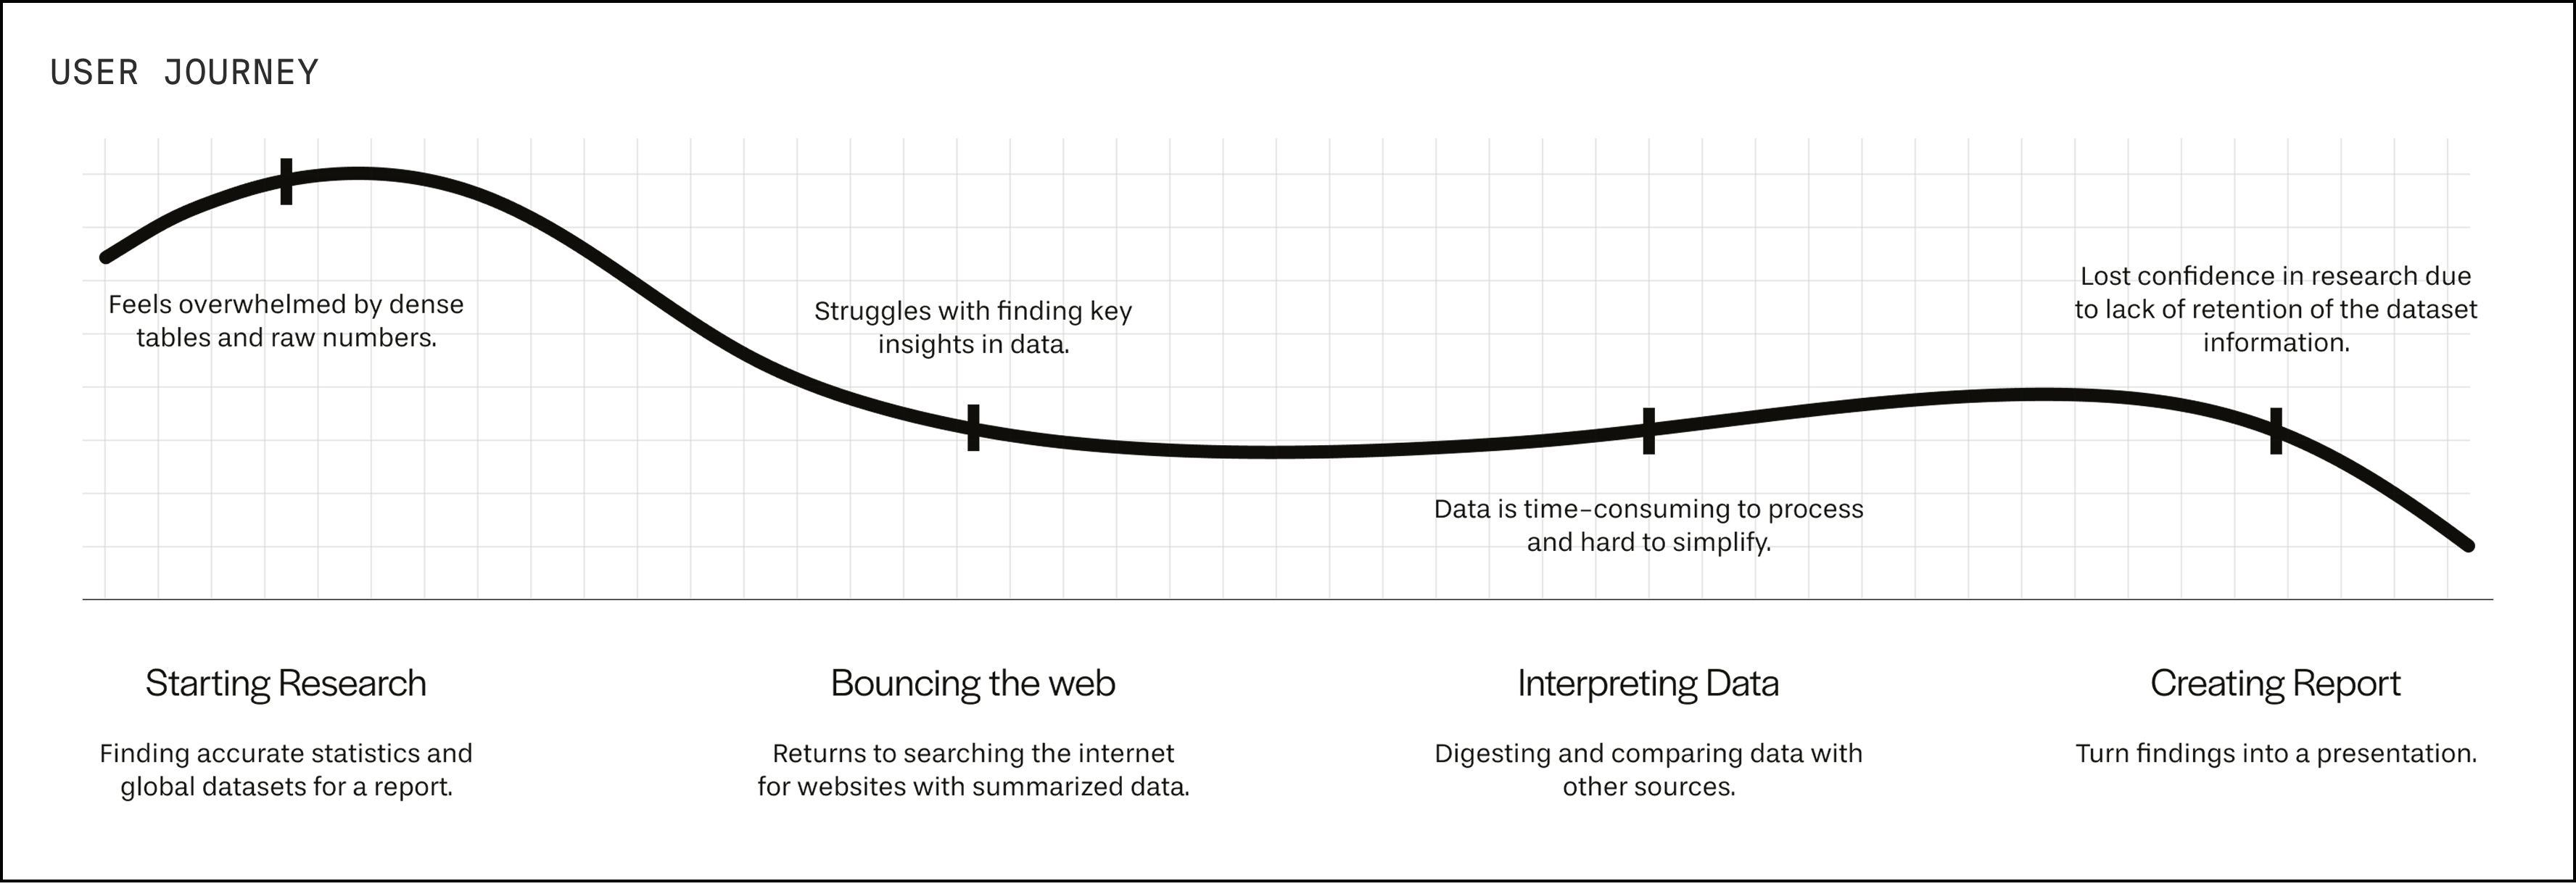
I focused on the process of what it would be like for Eris to research and gather key insights on datasets for her university presentations. It examines how information overload and cognitive barriers hinder her ability and confidence in her research.
- GOALS
-
• Quickly identify key insights and explain the datasets and their story in depth.
• Discover data changes over time.
• Find tools or methods that make dense data easier to interpret for a visual and kinesthetic learner. - PAIN POINTS
-
• Difficulty translating raw datasets into clear, engaging reports and presentations.
• Needs a way to make statistical information more cognitively accessible and easier to connect with.
• Finds it challenging to translate static data summaries into engaging stories.
THE PRIMARY DELIVERABLE
Redesigning the Traditional Web Article
A majority of the general population are visual learners—a learning style that large datasets usually don’t accommodate for. This is why we need to redefine the web article. Users should have a cognitively accessible tool that allows them to compare multiple metrics and that visually speaks on how the data moves or their relationships.
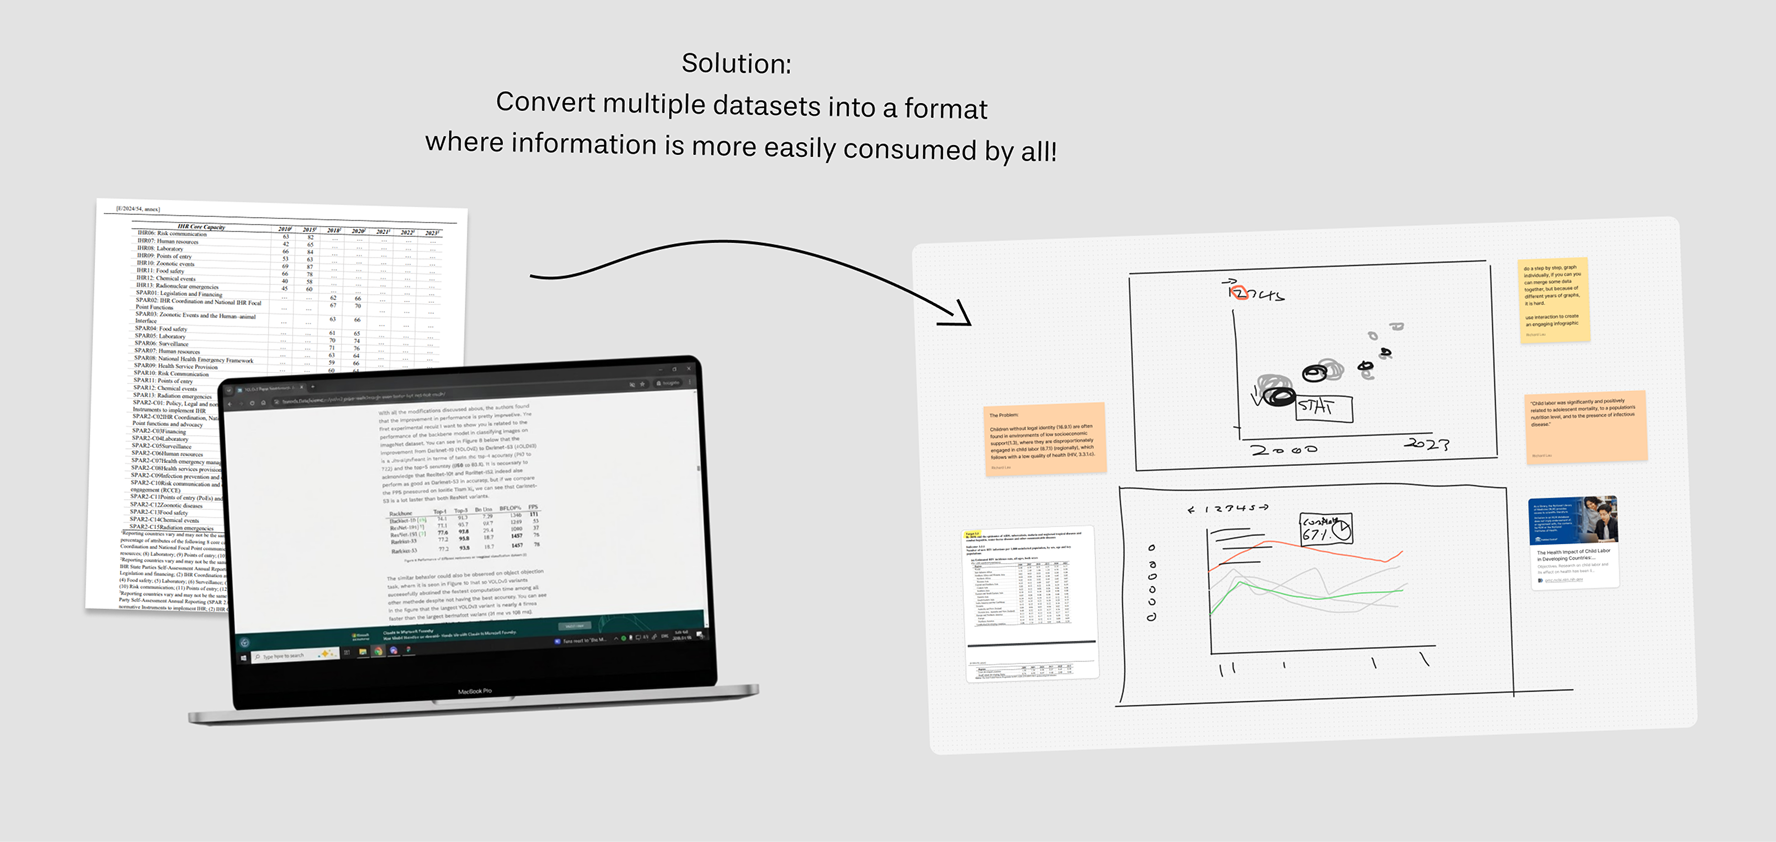
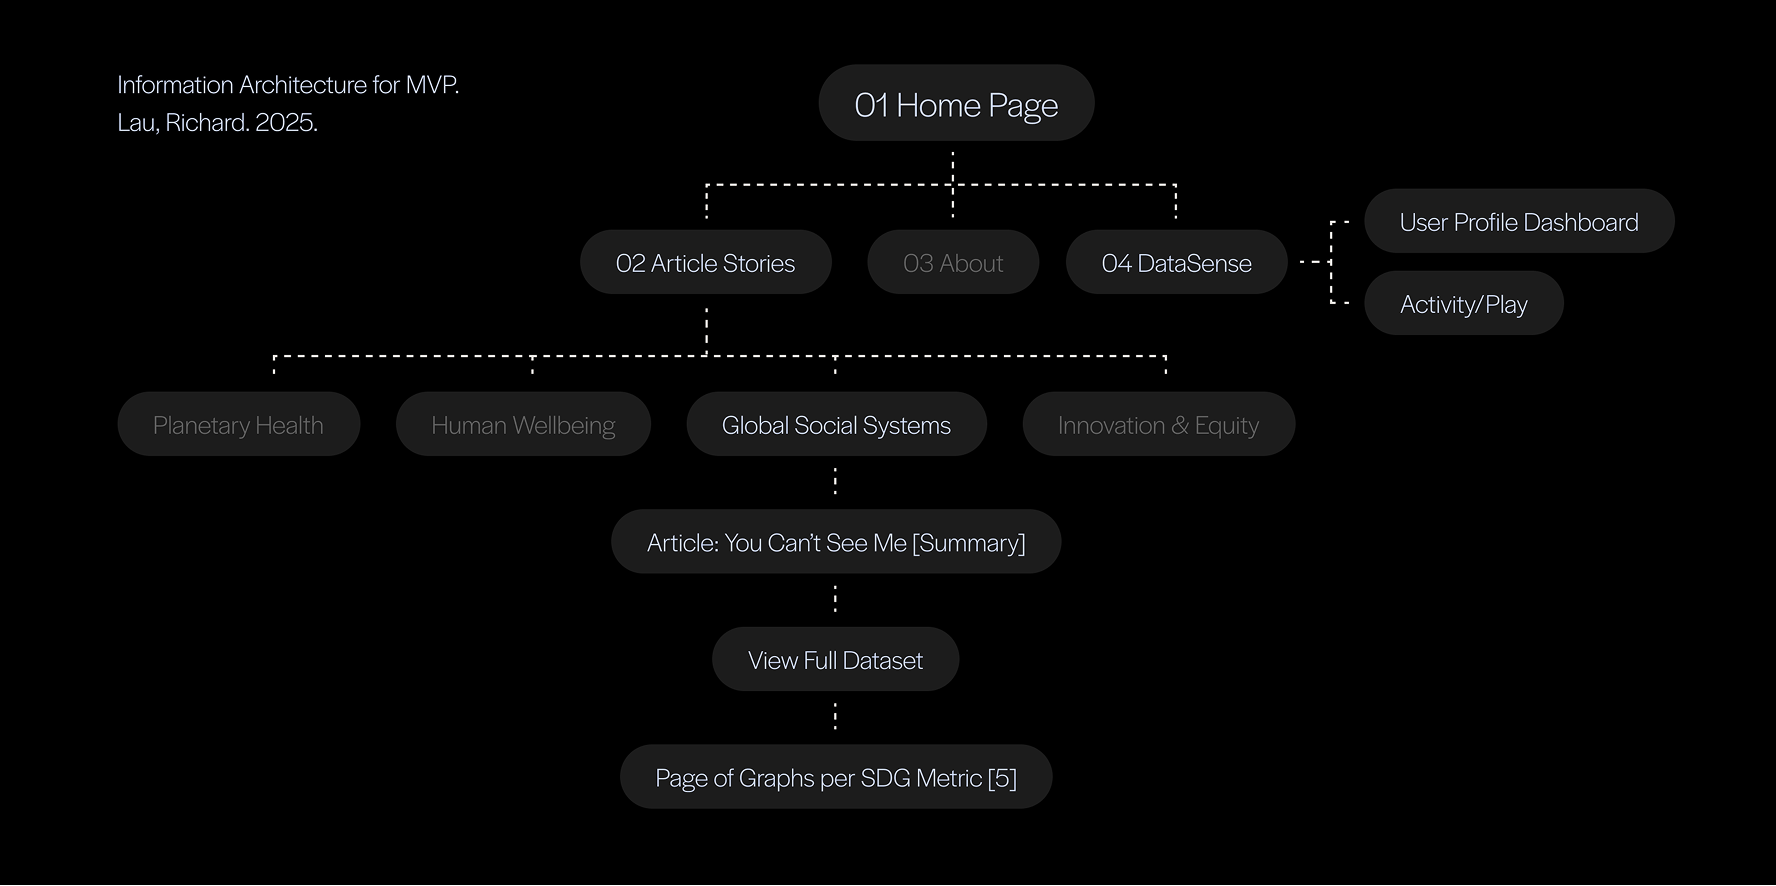
The data I’m using for my redesigned website article comes from 5 Sustainable Goals, from the 17 UN SDG datasheet. The objective will be to create a visual, comprehensive, and interactive narrative for multiple complex datasets.
- Users Need Accessibility
- 65% of the general population are visual learners—a learning style that research usually isn’t done in. It is essential that we are inclusive in the variability of all our user's abilities. Remember, accessibility does not only relate to colour contrast, but also to the comprehension of content!
DEFINING THE STORY
Making meaningful connections
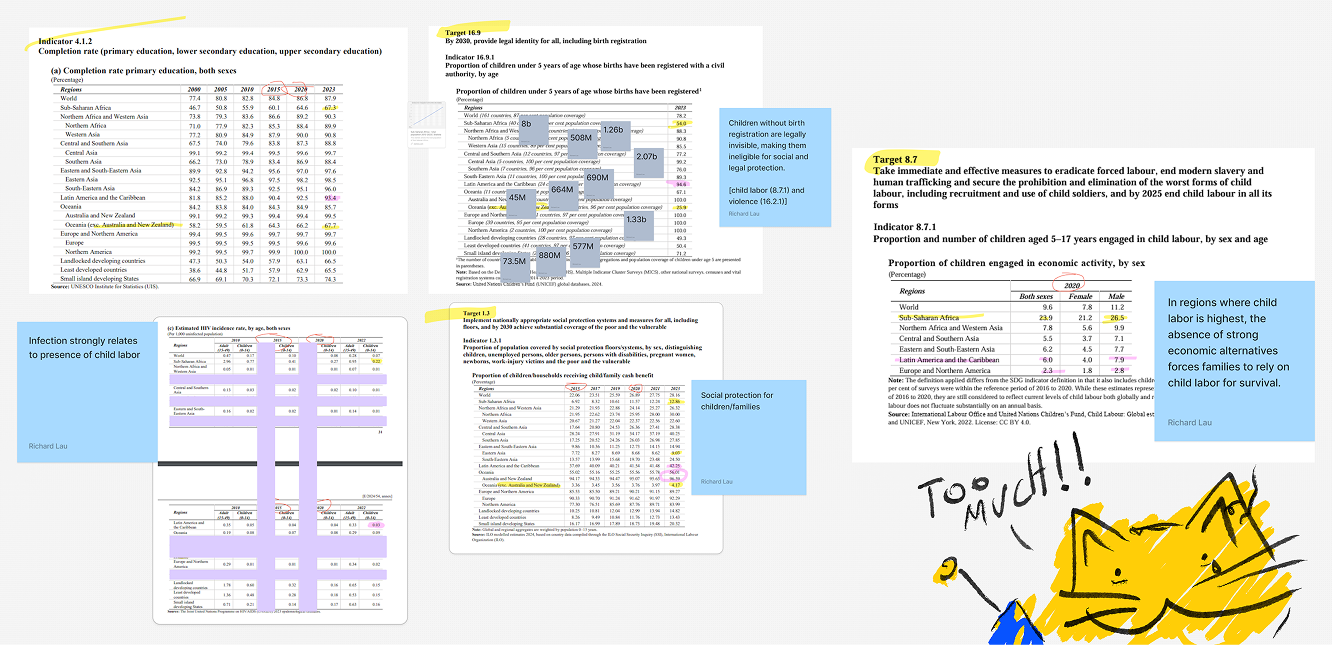
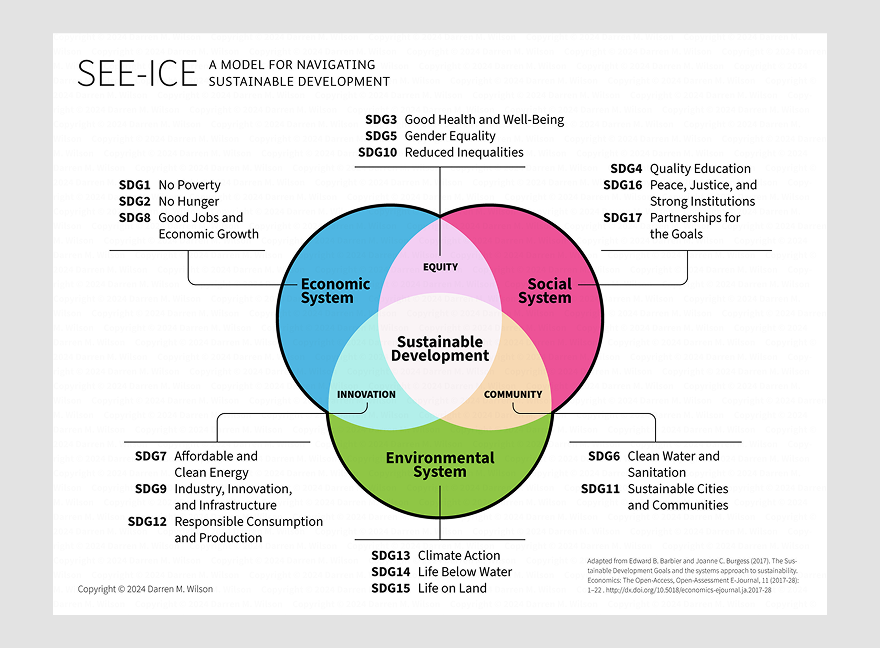
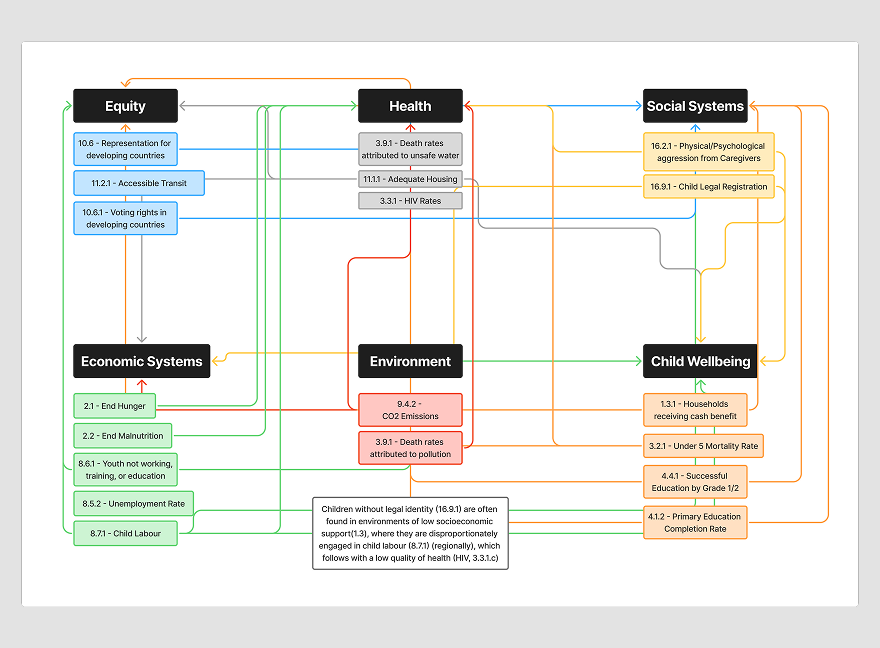
I used Darren Wilson’s SEE-ICE Model—A conceptual model for connecting primary drivers and secondary outcomes of sustainability to the United Nations SDGs—for navigating and identifying five interrelated connections between the 17 Sustainable Development Goals.
THE ARTICLE NARRATIVE
The Story to Tell
Children without legal identity (16.9.1) are often found in environments of low socioeconomic support (1.3), where they are disproportionately engaged in child labour (8.7.1) and less involved with primary education (4.1.2) (regionally), which follows with a low quality of health (HIV, 3.3.1.c).
DEFINING THE STORY
Making meaningful connections
I used Darren Wilson’s SEE-ICE Model—A conceptual model for connecting primary drivers and secondary outcomes of sustainability to the United Nations SDGs—for navigating and identifying five interrelated connections between the 17 Sustainable Development Goals.
DESIGN
Turning raw data into visual stories
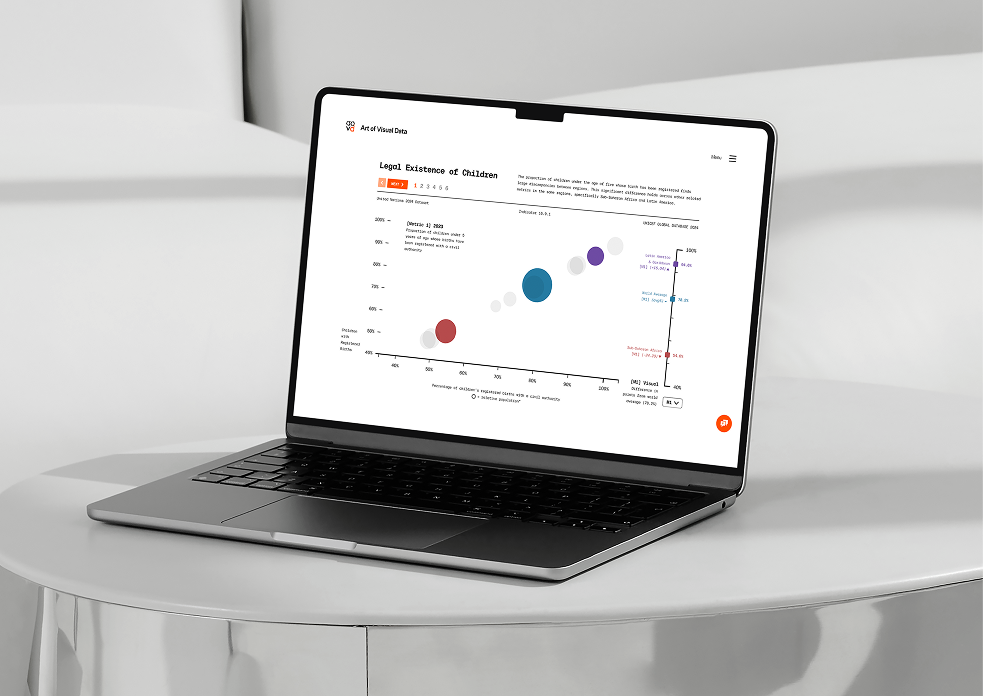
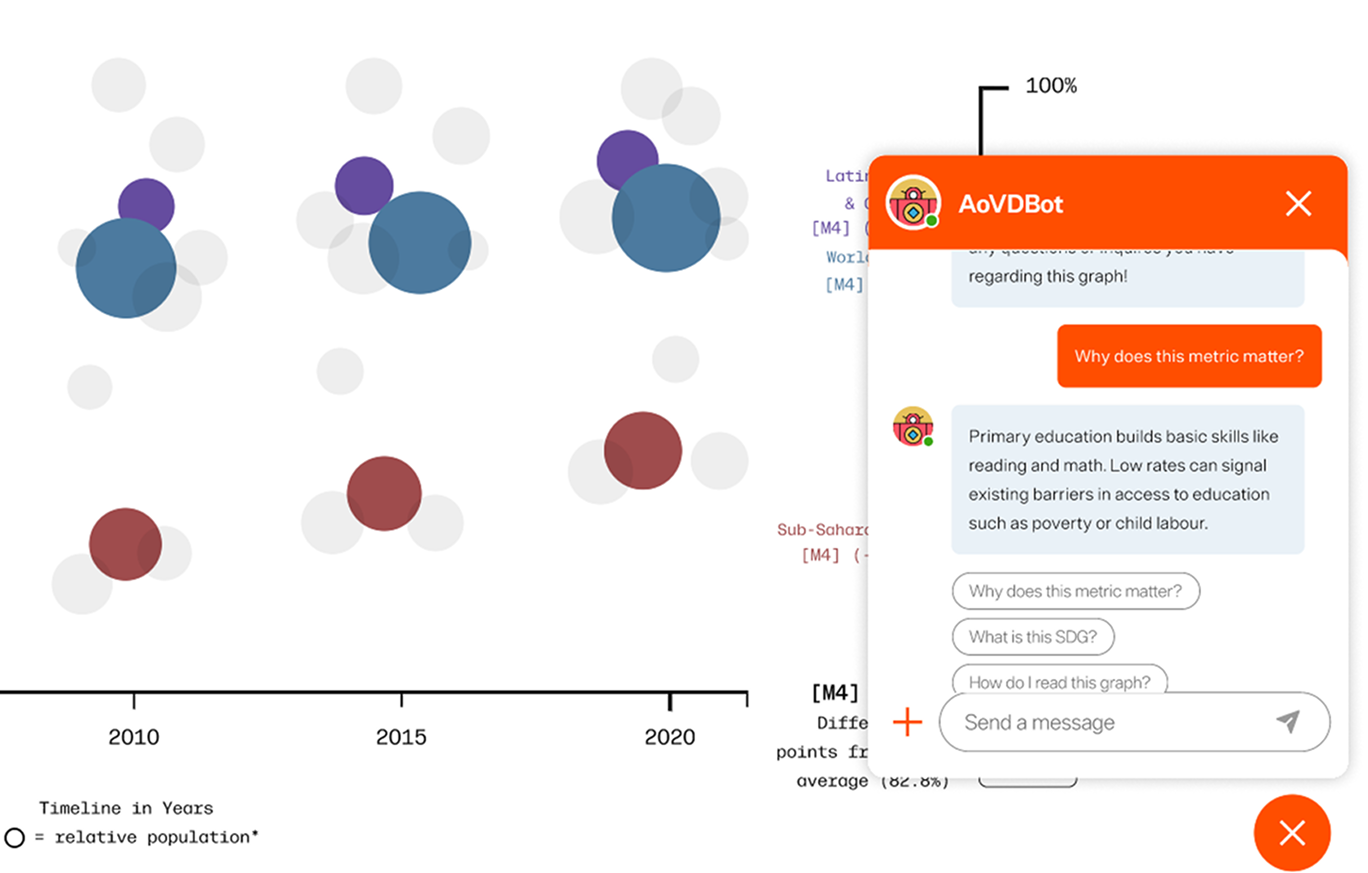
By transforming raw datasets into clear, interactive visuals, I turned hard-to-consume metrics into easily digestible stories and connections between metrics, timelines, discrepancies, and key data points. User confidence jumped by 60%.
- Building Confidence
- Only 24% of business decision makers considered themselves data literate. To improve user confidence and understanding in reading data. I utilized the linguistic strengths of Artificial Intelligence to implement the potential for a chatbot to maximize understanding and confidence for all learning types.
SUPPORTING DELIVERABLES
Building a community with Datasense
To turn Art of Visual Data into a communal platform for data learning, I created a tool. The 'DataSense' tool is designed for early learners interested in improving their data literacy skills. This tool gamifies learning with rankings, achievements, encouraging reflection and long-term engagement.
PRIMARY OUTCOME
What did we achieve?
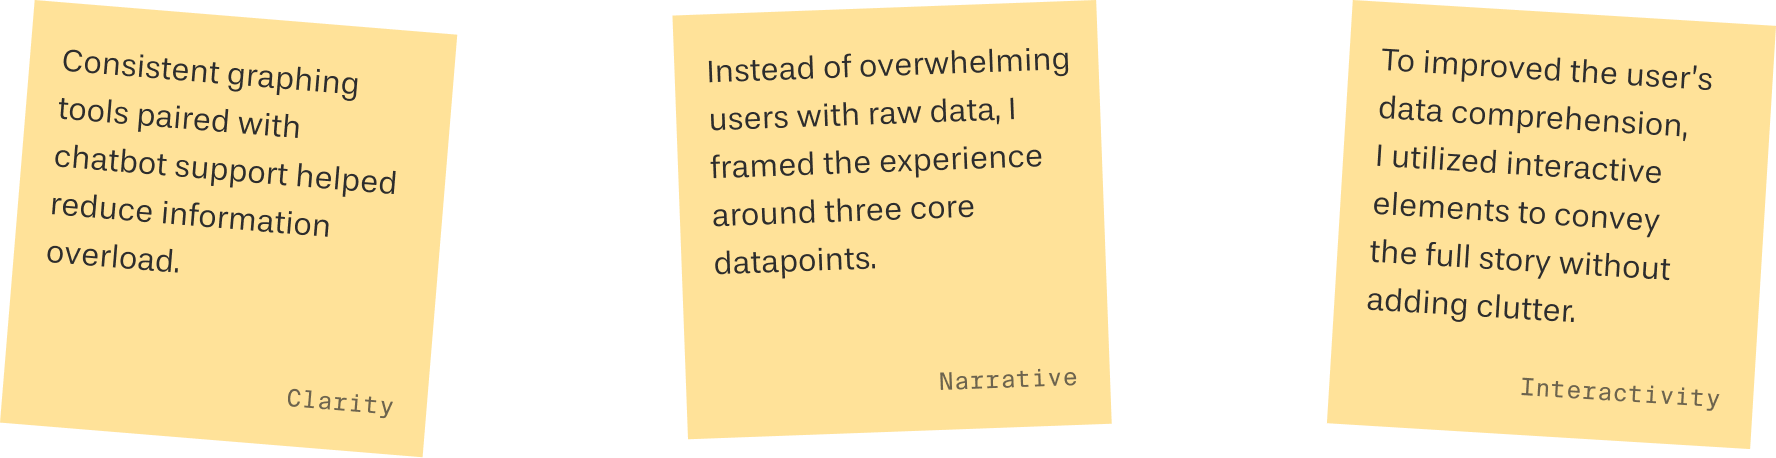
Through a redefined website article, I transformed raw data to have clarity, narrative, and interactivity. By building a stronger visual story, we save time and energy in the process of comprehending of large datasets.
ART OF VISUAL DATA HOME PAGE
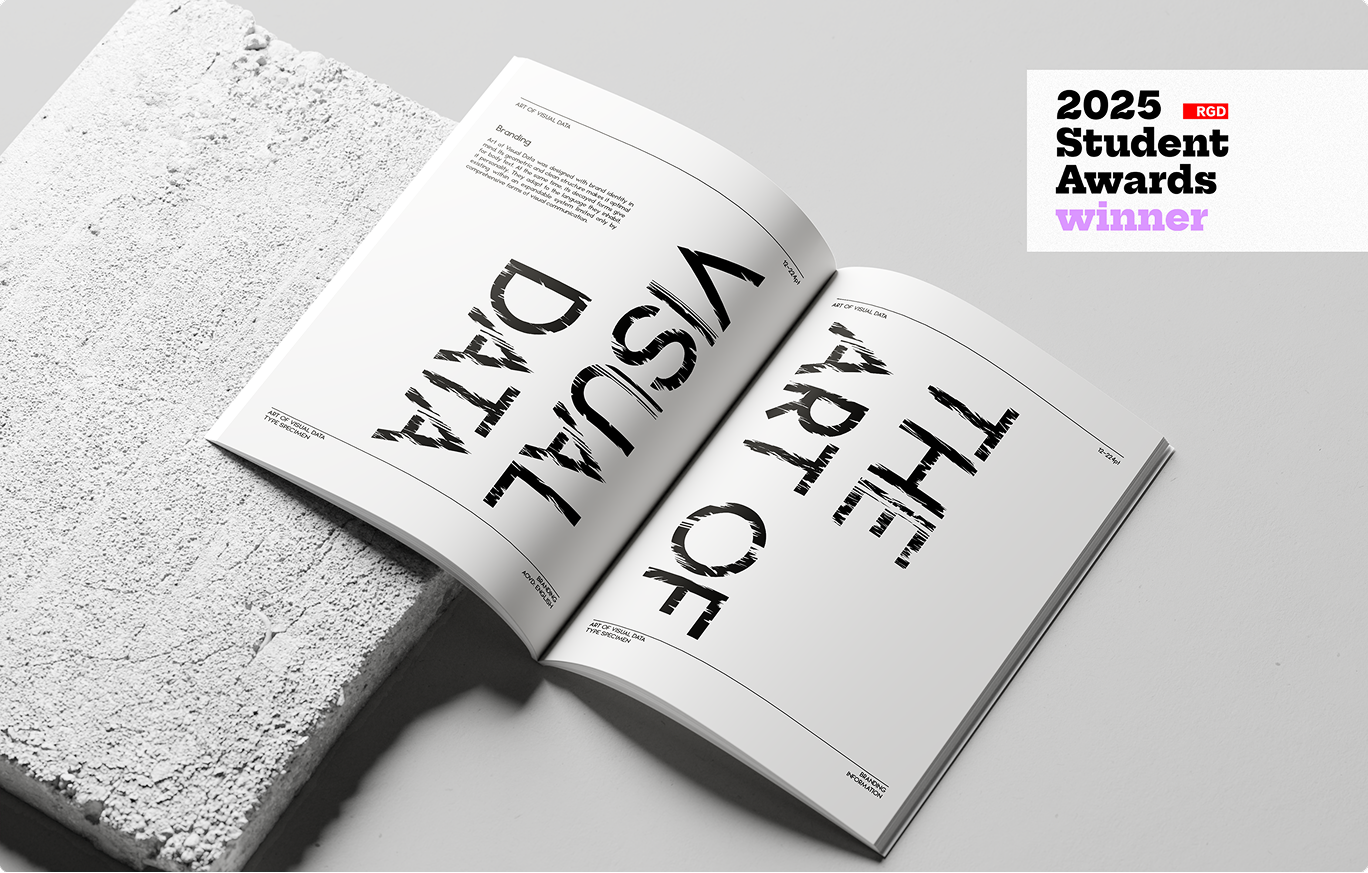
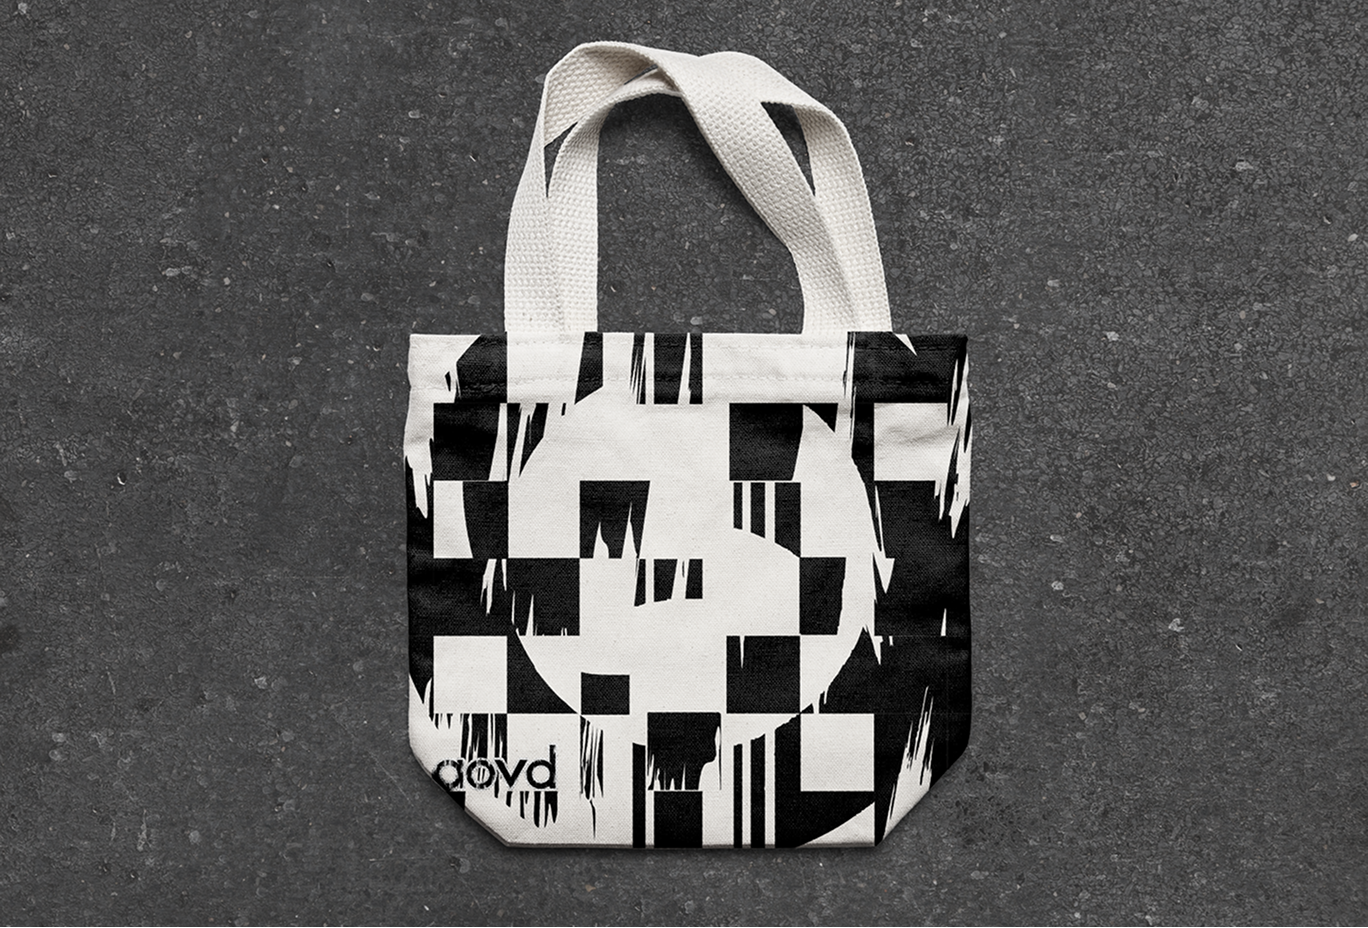
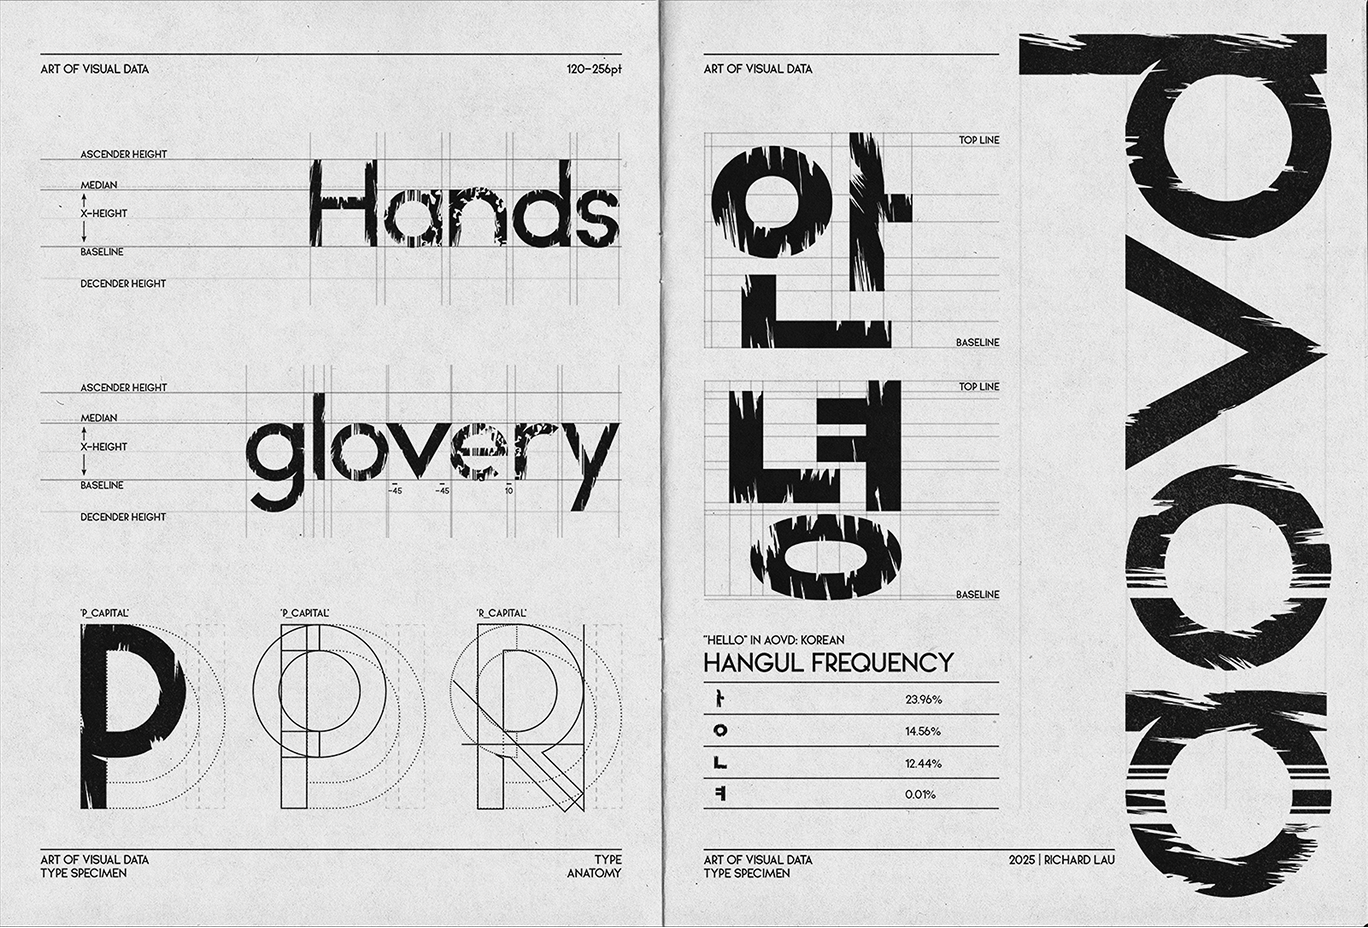
BONUS: ART OF VISUAL DATA CUSTOM TYPEFACE
REFLECTION
Concluding thoughts and achievements
- Reducing cognitive load
- I created a platform that provides clarity, narrative, interactivity, and cognitive accessibility in comprehending data.
- Design for future expansion
- The platform I structured allows for further expansion for new articles, collaborative tools, and growing communities.
- The 2025 RGD Student Awards
- This project, Art of Visual Data, has been selected by the 2025 RGD Student Awards as the winner for Web Design!
Next Project

Total Package
03- Team
- Solo
- Timeline
- January—April 2026
- Discipline
- Branding, Advertisement
1
2
3
4